Auger electron spectroscopy analysis at the ultrasonically welded interface between alumina and aluminum
- PDF / 665,364 Bytes
- 5 Pages / 612 x 792 pts (letter) Page_size
- 22 Downloads / 296 Views
THE authors have shown and reported the results on ultrasonic welding between aluminum (Al) and alumina (Al2O3), because the joining technology for metals to ceramics is needed in many industrial fields, such as micro– integrated circuit device manufacturing. In another report,[1] the authors have ultrasonically welded two kinds of Al2O3 with different amounts of SiO2 to an Al plate and revealed that the tensile shear strength of the joint between the Al plate and the Al2O3 containing a larger amount of SiO2 was higher than that of the joint with that containing a smaller amount of SiO2. This fact suggested that chemical reaction of SiO2 to Al at the interface seemed to assist the joint strength. However, another bonding force seems to exist due to the chemical reaction across the interface between Al and Al2O3, and it is probable that the force is a main force to bond them.[2] In the present study, the atomic interaction (chemical bonding) across the ultrasonically welded interface between Al and Al2O3 was analyzed using Auger electron spectroscopy (AES) in order to reveal the chemical bonding state at the interface. The information on the chemical bonding can be obtained by measuring the chemical shift of the Auger spectrum related to the valence electron. There has been a study to investigate the surface oxidation of transition metals using the AES technology to measure the chemical shift of Auger spectra.[3] It was verified on the basis of the AES measurements that chemical bonding could be achieved at the weld interface between Al and Al2O3 created by the ultrasonic welding process, which was completed using an ultrasonic pulse lasting for very short duration of approximately 1 to 1.5 seconds at room temperature.
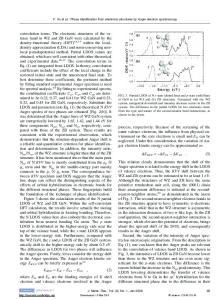
mass pct, and Ti: 0.03 mass pct) and alumina with a purity of 99.5 pct (Al2O3: 99.5 mass pct, SiO2: 0.1 mass pct, and the other elements unknown). The Al specimen to be welded is a strip with dimensions of 100 ⫻ 10 ⫻ 0.5 mm in thickness. The Al2O3 specimen is a cube with dimensions of 10 ⫻ 12.5 ⫻ 10 mm in height. The faying surface of the Al specimen was electrolytically polished, and its surface roughness was 0.4 mm. The faying surface of the Al2O3 was finished with a wet Emery paper of 1500 grit, and the surface roughness was 1.8 mm. The output power and vibration frequency of the ultrasonic welding machine were 1200 W and 15 kHz, respectively. The vibration amplitude was 45 mm (peak to peak at no loading). The setting of the welding specimens is schematically shown in Figure 1. The upper Al specimen was vibrated to the direction shown in Figure 1. The clamping load was 588 N, and the welding duration was 1.5 seconds. The welded area was approximately 10 ⫻ 10 mm. B. The AES Analysis of the Welded Interface The preparation of a specimen for AES analysis was as follows. First, a 3-mm-thick specimen was cut from the joined area (10 ⫻ 10 mm) of the weld. Second, the Al surface welded to Al2O3 was polished using a wet emery paper and diamond buffing until the thickness of the Al became as thin as possib
Data Loading...