Deposition and Photocatalytic Activity of Ag:V 2 O 5 Thin Films
- PDF / 319,731 Bytes
- 6 Pages / 612 x 792 pts (letter) Page_size
- 55 Downloads / 292 Views
ISCUSSION Compositional characterization Figure 1 shows the Ag content in the films as a function of the silver/vanadium ablated areas. It is clearly observed that as the ablated area of the silver target is increased, the Ag content increases from 0.7 to 9.0 at. %, suggesting that the silver content in the prepared thin films was varied in a controlled way. This behavior seems reasonable, because a higher ablated area of the Ag target corresponds to a higher ablation rate and consequently more Ag species arriving to the substrate available to be incorporated into the growing film. 9
Ag content ( at. %)
8 7 6 5 4 3 2 1 0.10
0.15
0.20
0.25
0.30
0.35
0.40
0.45
0.50
Ag/V ablated areas ratio
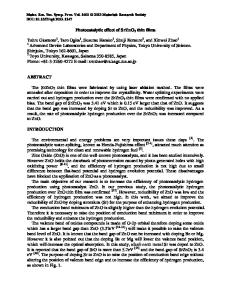
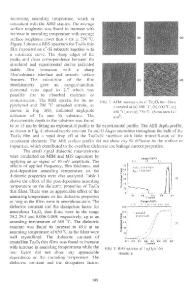
Figure 1. Silver content as a function of the silver/vanadium ablated areas Raman characterization The Raman spectra of films with Ag content lower than 1.6 at. % show peaks at 144, 194, 284, 303, 404, 484, 702 and 994 cm-1 as is shown in figure 2. These Raman features are characteristic of V2O5 [8]. As the content of Ag was increased in the films, new features appears at 218, 300, 380, 429 and 487 cm-1 which correspond to AgO. It is noticed that at the highest Ag content in the film the corresponding Raman spectrum show peaks at 234, 432, 489, 560, 943 and 963 attributed to the formation of AgO2 [9]. The Raman results suggest that as the Ag is incorporated into the deposited material, a mixture of vanadium oxide (V2O5) and silver oxides (AgO and AgO2) compose the film. Optical microscopy The optical images of the films surface deposited with different Ag contents are shown in figure 3. It is observed that the film surface became covered with a large number of cuasi spherical particles as the silver content was increased. The film deposited without Ag showed a very smooth surface without particles. The number of these particles increases with increasing the amount of silver in the film and could be attributed to coalescence of Ag species. EDS measurements showed that such particles are composed of silver suggesting the formation of Ag nanoparticles.
Ag = 0 at.% Ag = 0.7 at.% Ag = 1.2 at.% Ag = 1.6 at.% Ag = 2.0 at.% Ag = 5.4 at.% Ag = 9.0 at.%
* V2O5 *
Intensity (arb. u.)
157 172 252 213 268 124 234 304
*
438 455 491
*
*
*
675
775
891
943 962
*
*
*
100 200 300 400 500 600 700 800 900 1000 -1
Raman Shift (cm ) Figure 2. Raman spectra of films with different silver atomic content. 25
25
20
20
15
15
10
10
5
Y (µm)
Y (µm)
5
0
-5
-1 0
-1 0
-1 5
-1 5
-2 0
-2 0
-2 5
-2 5
2 µm -3 0
-2 0
-1 0
0 X (µm)
10
20
30
25
25
20
20
15
15
10
10
5
5
Y (µm)
Y (µm)
0
-5
0
-2 0
-1 0
0 X (µm)
10
20
30
-3 0
-2 0
-1 0
0 X (µm)
10
20
30
0
-5
-5
-1 0
-1 0
-1 5
-1 5
-2 0
2 µm -3 0
-2 0
-2 5
2 µm -3 0
-2 0
-1 0
0 X (µm)
10
20
30
-2 5
2 µm
Figure 3. Optical images of thin films at different silver content
UV-Vis spectroscopy The optical absorption spectra, in the reflectance mode, of the prepared films as a function of the silver content are shown in figure
Data Loading...