Low Temperature Hydrogen Induced Degradation of (Ba,Sr)TiO 3 Thin Film Capacitors
- PDF / 906,506 Bytes
- 6 Pages / 417.6 x 639 pts Page_size
- 60 Downloads / 317 Views
25 Mat. Res. Soc. Symp. Proc. Vol. 596 © 2000 Materials Research Society
either sputtering a blanket layer (Pt) and patterning by photolithography or by electronbeam evaporation (Pt, Au) through a shadow mask. After the top electrode deposition samples were annealed in 1 atm 02 at 550C for 15 minutes. The samples were then placed in flowing forming gas (95% Ar 5% H2 or D 2) at 23C for 20 minutes. Electrical measurements were used to characterize the complex capacitance, C-V, relaxation currents, and leakage of the films. The impedance and C-V of the capacitors were measured from 100 Hz to 40 MHz by an HP4194A impedance gain phase analyzer with an A.C. oscillation level of 50 mV. Current measurements were made using an HP4140B pico ammeter and a voltage step technique was used to separate the relaxation and leakage currents. SIMS measurements were carried out on a Cameca 5F using a 14.4 keV Cs' primary beam. Deuterated forming gas was used to increase the signal to background ratio. Hydrogen FGA produced similar degradation in electrical properties. RESULTS and DISCUSSION Electrical Properties and SIMS Profiling 1E-5
1E6
1E-6 1E-7 2'
1E-7
7)
.efeF 1E-8
P
1E-9
E A1I• _.........
O
0
t•ce-G
S......
1E-10
afterFGA 1E-9
FGA
1-9 E
bf ore FGA
1E-10 IVtop electrode
6
IV Top Electrode +1V Top Electrode
1E-1-+Voperode1
1E-11
.
1
10
.
.
lE-11
..
1
100
Time (Sec)
10
100
Time (Sec)
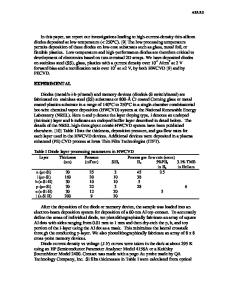
Fig. 1 Charging currents for a 30 nm
Fig. 2 Discharging currents for the same 30 nm MOCVD BSTO capacitor as shown inFig. 1.
MOCVD BSTO capacitor with Pt
electrodes before and after 23C FGA.
The degradation in electrical properties that occur after placing Pt/BSTO/Pt capacitors (BSTO thickness 30 nm) in flowing forming gas (95% Ar 5% D 2) at 23C for 20 minutes is shown in Figs. 1 and 2. Fig. 1 shows the charging currents after application of +(solid line)/-(dotted line) I Volt to the top electrode before and after 23C FGA. The leakage currents before the FGA are low (- 10-9 A/cm 2 at 100 seconds) and nearly symmetrical with applied bias of either polarity. After 23C FGA the leakage currents are highly asymmetrical with the greatest leakage occurring (more then two orders of magnitude greater) when a negative voltage is applied to the top electrode. Under these conditions electrons are injected from the top electrode indicating that the effective Schottky barrier height at the top interface has been significantly lowered due to the FGA. While the steady state leakage is greatest when a negative voltage is applied to the top electrode, both interfaces exhibit higher leakage than the before FGA sample showing
26
that 23C FGA has affected both top and bottom interfaces. An analysis of the temperature and field dependence of the leakage current using the Schottky expression [7] yields a Schottky barrier height of 0.76 +/- 0.05 eV for the top interface and 1.07 +/- 0.05 eV for the bottom interface. The barrier height before FGA was 1.17 +/- 0.05 eV for the top interface and 1.22 +/- 0.05 eV for the bottom interfac
Data Loading...