Quantitative Analysis of Raman Spectra from Diamond Like Carbon: Calibration Transfer
- PDF / 313,725 Bytes
- 6 Pages / 391.5 x 607.5 pts Page_size
- 12 Downloads / 290 Views
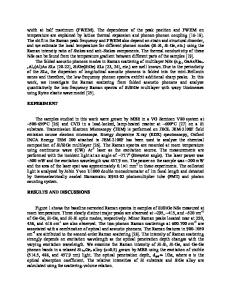
we report on the instrumentation and methodology required for comparing Raman measurements taken on different Raman analyzers. Raman spectroscopy has taken on an increasingly important role in materials processing because of its capability of performing non-destructive, in situ characterization of thin films. In particular, non-
crystalline carbon coatings have become ubiquitous as protective layers on everything from machine tools to hard disk drives. As tolerances on coating properties begin to play an important part in determining device failure, Raman spectroscopy has found ever greater application as a quality control/quality assurance tool. However, use of Raman as an analytical tool has been hampered by the inability to quantitatively compare spectra obtained with different Raman analyzers. By using automated, robust calibration protocols on both the wavelength and intensity axes, we have demonstrated cross-instrument calibration transfer of DLC films.
1
Introduction
Over the past decade, the hardness and chemical inertness of thin carbon films have found uses ranging from wear-resistant coatings on magnetic storage media (see, for example, [1]) to protective coatings for plastics (e.g. [2]). The structure of these coatings can range from purely crystalline diamond [3] to an amorphous network of three-fold and four-fold coordinated carbon atoms [4]. The present work demonstrates that proper calibration of Raman instrumentation results in significant improvement in the quantitative interpretation of the Raman spectrum of DLC films. While this statement may seem trivial, it is only for broad bands such as those of amorphous materials that the instrument response function varies sufficiently to alter the apparent shape of the Raman band. It is only in the last few years that Raman has been used as an at-line analytical technique for material processing feedback (see, for example, [5]); thus, only recently has a strong financial need arisen to quantitatively compare Raman spectra obtained from different instruments in different parts of the world.
2
Experiment
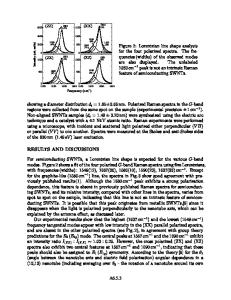
Two sample sets were used in this study. Non-disclosure agreements with the sample providers prohibit detailed discussion of the sample properties and the substrate material. The first set consists of six samples with differing carbon overcoats. Quantitative results detailing the effect of intensity axis correction are drawn from this data set. The second set consisted of a single hydrogenated DLC sample on a magnetic media substrate. This sample serves to show the effect of the correction on a film and substrate similar to those used in the magnetic media industry. Raman spectra for the first set were obtained with a Hololab 5000 Raman microscope and a Holoprobe Raman analyzer. Both used a 50x objective to focus a 12 yrm spot on the sample. The Hololab 5000 analyzer focused 20 mW of laser power onto the sample, while the Holoprobe analyzer focused 35 mW onto the sample. Raman spectra for the first set were obtained from four different points on eac
Data Loading...