Recomputation of Phase Equilibria in the Sodium-Carbon-Oxygen System: Effect of Oxygen
- PDF / 167,378 Bytes
- 2 Pages / 594 x 774 pts Page_size
- 9 Downloads / 339 Views
CONCLUSION
where
The enhanced hydrogen stress cracking resistance of AISI 4130 steel modified with 0.75 pct Mo and 0.035 pct Nb, when tempered above 600 ~ is the result of Fe2MoC precipitation. These very fine carbides apparently act as benign hydrogen traps reducing the detrimental effect of hydrogen observed in the standard 4130 alloy.
ACKNOWLEDGMENT The author would like to thank Marathon Oil Company for permission to publish this work.
REFERENCES 1. P.J. Grobner, D.L. Sponseller, and W.W. Cias: Mat. Perform., 1975, vol. 14, pp. 35-43. 2. P.J. Grobner, D. L. Sponseller, and D. E. Diesburg: Trans. ASME, J. Eng. Ind., 1976, vol. 98, pp. 708-17. 3. W.C. Mack, G. Molitor, and J. D. Gottschling: unpublished research, Babcock & Wilcox Co., Beaver Falls, PA, 1981. 4. P.J. Grobner, W. C. Hagel, and V. Biss: unpublished research, Climax Molybdenum Co., Ann Arbor, MI, 1978. 5. P.J. Grobner, D.L. Sponseller, and D.E. Diesburg: Corrosion, 1979, vol. 35, pp. 240-50. 6. B.D. Craig and G. Kranss: Metall. Trans. A, 1980, vol. l lA, pp. 1799-1808.
7. S. Kanazawa, A. Nakashima, K. Okamoto, K. Tanabe, and S. Nakazawa: Tran. JIM, 1967, vol. 8, pp. 113-20. 8. B.D. Craigand G. Krauss:Hydrogen Effects in Metals, TMS-AIME, I.M. Bernstein and A.W. Thompson, eds., 1981, p. 795. 9. B.D. Craig: Scripta Met. 1981, vol. 15, pp. 91-94. 10. B.D. Craig: Res. Mechanica Letters, 1981, vol. 1, pp. 551-54. 11. G.M. Pressouyre and I.M. Bemstein: Metall. Trans. A, 1981, vol. 12A, p. 835. 12. G.M. Pressouyre and I. M. Bernstein: Metall. Trans. A, 1978, vol. 9A, pp. 1571-80. 13. T. Asaoka, G. Lapasset, M. Aucouturier, and P. Lacombe: Corrosion, 1978, vol. 34, pp. 39-47.
K1 = Pco (Po2)1/2 Pco2
The total pressure is now
[2]
Pco + PCO2 + PNa + Po2 = PT
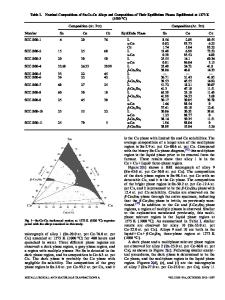
Using Na2CO3 as a typical example, calculation of the Na2CO3 equilibria involves substitution of K4 (original paper) and K1, above, into Eq. [2]. The recalculated stability diagram is shown in Figure 1. As log (Pco) becomes more negative, the value of l o g (PNa) decreases to a minimum at about 10 -12 atm and subsequently increases. Therefore, above about Pco = 10-9 atm, the NaECO3 equilibria is unchanged in Figure 1 (original paper). Similar calculations for Na20, Na202, and NaO2 show limiting values of PNa as 10g (Pco) becomes more negative. As is the case for Na2CO3, the equilibria for these three phases are unchanged in Figure 1 (original paper) above about Pco = 10-9 atm. As a consequence, Figure 2 (original paper) remains unchanged. An examination of Table I shows that there is neither 3 phase NaECO3 + Na202 + NaO2 equilibria nor 3 phase NaECO3 + NaO2 + gas equilibria as was the case in the original paper. 1 Thus, in Figure 2, there are no regions equivalent to 4 or 6 in Figure 3 (original paper). However, there is 3 phase Na2CO3 + Na202 + gas equilibria as defined by the NaECOa-Na202 intersection in Table I. The changes in the stability diagrams at 1250 K and 10.0 atm and at 1400 K and 1.0 atm are quite similar to those presented in Figure 1 and Table I and will not be presented in this com
Data Loading...