SEM Observation of the Influence of Sucrose and KOH on Formation of Sulphoaluminate Hydrates of a Cement Clinker During
- PDF / 3,720,526 Bytes
- 9 Pages / 414.72 x 648 pts Page_size
- 55 Downloads / 297 Views
Mat. Res. Soc. Symp. Proc. Vol. 370 0 1995 Materials Research Society
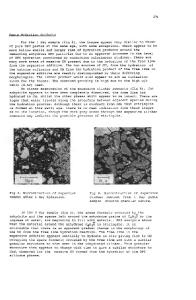
diameter and 10 mm in thickness, burned at 1350'C in a high temperature furnace for 2 h, and then cooled in air. The potential phase composition was C3S: C2S: C3 A: C4AF=60: 10: 30: 0. The amount of free CaO was determined as being lower than 0.1%. Preparation of solutions Proper amounts of Ca(OH)2 and CaSO4.2H20 were put into 3 bottles with 1000 ml distilled water, and 2.8g, 5.6g and 1 1.2g of KOH were respectively added. After maintaining at 20'C for 4 h, 3 supernatant liquids of 0.05M, O.1M and 0.2M KOH concentration were obtained. They were then transferred to 9 smaller bottles, and then predetermined amounts of sucrose were added into each. To each kind of KOH solution, three concentrations of sucrose were added, i.e. 0.03 %, 0.3 % and 3 %.Thus 9 solutions were obtained for use. Preparation of samples The synthesized bulk clinker was cut into small plates of about 5 mm x 5mm area and 3 mm in thickness. These were then ground and polished to obtain a smooth surface. Subsequently, sample plates were immersed into each of the above mentioned 9 solutions for predetermined immersion periods (6 s, 6 min and 1 h) and then taken out and immersed in acetone and ether successively to stop the hydration process. The samples were then sputtered with carbon and studied by SEM and EDS. RESULTS Figs. 1 to 9 show typical SEM photographs of hydrated surfaces of the various samples. The hydration product phases were recognized by using EDS data as shown in Table 1. As shown in those figures, the surfaces of all clinker platelets have been etched by hydration after 6 s immersion in the solution saturated in Ca(OH) 2 and CaSO4.2H 2 0 in 6 s, irrespective of the concentrations of KOH and sucrose. The degree of etching increases with the amount of sucrose. The hydrates are readily detectable. Most hydrates appear in the form of needles or prisms (Figs. 1(a), 2(a),..9(a)). Some of them have a perfect crystal forms, as shown in Fig. 3(a). The hydrates with needle or prism forms have been determined to be AFt, according to EDS data. After 6 min, the degree of etching by hydration, and the morphology of the AFt vary with the hydration conditions. The sample which was immersed in solution with more sucrose is more strongly etched than that after only 6 s. AFt crystals are significantly increased in amount and size (Figs. 1(b), 4(b) ,7(b) and 8(b)). For example, AFt formed in the solution with 0.3% sucrose and 0.2M KOH is about 10 gm in length and 1 gm in diameter (Fig. 8(b)). However, on the sample with more sucrose, AFt crystals almost do not change in amount. By 1 h, with less sucrose AFt crystals cover almost the entire surface of the samples (Figs. 4(c), 7(c) 1(c)). The amount of AFt crystals increases with the KOH concentration. With an intermediate amount of sucrose, the AFt crystals are longer, but the amount produced is less. With more sucrose, the AFt crystals appear in the form of rounded elongated crystals projecting from common centers (Fig. 6(c), Fig.9(
Data Loading...