Survey of Formulas Used to Describe the Fatigue Crack Growth Rate
- PDF / 380,379 Bytes
- 11 Pages / 594 x 792 pts Page_size
- 15 Downloads / 245 Views
SURVEY OF FORMULAS USED TO DESCRIBE THE FATIGUE CRACK GROWTH RATE D. Rozumek We present a survey of formulas for the fatigue crack growth rate. The equations are split into three groups according to the used parameters of fatigue damage, i.e. stress, strain or displacement, and energy. The parameter K or its range ΔK corresponds to brittle materials and to the initial stage of cracking of elastic-plastic materials. The parameter ε or CTOD is used in elastic-plastic materials and plastic materials to describe the yield strength. The energy approach is based on the parameter J or the strain-energy density W and corresponds to the entire range of the curve of crack growth rate. Keywords: fatigue crack growth rate, stress intensity factor range, CTOD, parameter Δ J .
The fatigue crack growth rate is applied to describe the increasing slots in materials. Depending on the applied stress, strain, displacement, or energy approach, the fatigue crack growth rate can be represented as a function of one of the mentioned parameters. The description of the rate da/dN versus the stress parameter K is
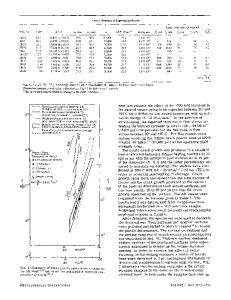
one of the most often applied descriptions. The energy approach using the parameter J for the description of the curve da/dN = f (ΔJ ) was proposed by Rozumek and Marciniak [1] as the equation discussed in this paper. The relation between the range of Δ J and the fatigue crack growth rate da/dN ( da is the increment of
crack length for dN loading cycles) was shown as the curve of crack growth kinetics [2] (see Fig. 1). The plot in Fig. 1 is presented on double logarithmic coordinated and its shape is the reverse S . For low values of the range Δ J for a given material and a constant stress ratio, we have the threshold value of Δ J th . The fatigue crack does not develop below that value. In the threshold value range and in the case of short fatigue cracks, plasticity does not occur and the equations of linear-elastic fracture mechanics can be applied (the range of the stress intensity factor ΔK is used for description). As follows from Fig. 1, the instability occurs under higher values of Δ J , thus causing a quick increase in the crack growth rate up to the critical value of J Ic (just prior
to the total failure of the tested material). There are two possible causes of this behavior. First, the increasing crack length under constant loading causes the fact that the stress reaches the critical value. Then the observed unstable behavior of the crack growth curve is connected with the previous stages of brittle cracking [1]. This type of behavior takes place in brittle materials where the stress is predominant and the experimental results are mainly related to the linear crack mechanics. The second cause is connected with the process of crack growth leading to the reduction of the noncracked area of the specimen, which affects the total plasticization of the material under limited loading. This aspect concerns elastic-plastic and plastic materials in which a visible yield point occurs and the materials are subjected to large plastic
Data Loading...