The Use of a Thermal Imaging System to Measure the Temperature of the Body of a Hot-Metal Mixer
- PDF / 237,746 Bytes
- 2 Pages / 594 x 792 pts Page_size
- 15 Downloads / 306 Views
Vol. 54, No. 3, September, 2013
REFRACTORIES IN HEATING UNITS THE USE OF A THERMAL IMAGING SYSTEM TO MEASURE THE TEMPERATURE OF THE BODY OF A HOT-METAL MIXER Z. K. Kabakov1 and D. V. Chudinov1 Translated from Novye Ogneupory, No. 5, pp. 3 – 4, May, 2013. Original article submitted October 12, 2012. Results are presented from the use of a thermal imaging system to evaluate the thermal state of a hot-metal mixer. Key words: thermal imaging system, hot-metal mixer, lining.
Thermal imaging systems have begun to be used in blast-furnace smelting to monitor the surface temperature of the shell of the hot-metal mixer. The temperature distribution is shown on the display of the system as a color field in which each color corresponds to a certain temperature. As a rule, the display shows the temperature field on the section of the surface that is visible in the objective lens.
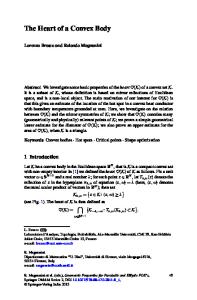
The “Severstal’” Metallurgical Plant uses a 600-ton-capacity hot-metal mixer to transport molten pig iron from the blast-furnace shop to the converter shop along a rail line. The mixer is barrel-shaped and is lined internally with three layers of fireclay and mullite-corundum brick. Figure 1 shows a schematic diagram of the mixer and its lining [1]. Severstal’ uses a thermal imaging system made by the American company “Flir” to monitor the mixer’s thermal state. The system shows the sections of the shell of the mixer on which the temperature might be above or close to the limit allowed by safety standards. It also shows section in which the shell or
1 Cherepovets State University, Cherepovets, Volgograd Oblast, Russia.
TABLE 1. Number of zone
1
2
3
4
5
6
7
8
9
10
Temperature, °C
146
164.2
137.5
150.9
186.4
189.7
180.9
187
173.4
186.7
Number of zone
11
12
13
14
15
16
17
18
19
20
Temperature, °C
173.7
185.3
165.4
190.2
167.6
187.5
152.4
168.4
155.9
165.0
Fig. 1. Diagram of hot-metal mixer MP-600 and its lining: 1 ) shell of mixer; 2 ) fireclay brick installed in two layers; 3 ) mullite-corundum brick; 4 ) small cylinder; 5 ) large cylinder; 6 ) high-rate-mixing zone.
149 1083-4877/13/05403-0149 © 2013 Springer Science+Business Media New York
150
Z. K. Kabakov and D. V. Chudinov
Fig. 2. Diagram showing the different measurement zones of hot-metal mixer MP-600.
Fig. 3. Results from determination of the temperature distribution in different zones of the mixer (1 – 20 ) with the use of the thermal imaging system.
refractory lining has been damaged. The range of temperature measurement by the system’s camera is 0 – 210°C and the measurement error is ±2% [2]. The thermal imaging system is used to measure temperature in 20 zones: 10 on each side of the mixer (Fig. 2). Figure 3 shows measurements made with the system. An analysis of the temperature distribution in each zone of the mixer determined the maximum temperature (Table 1). It can be seen that the maximum temperature (185.3 – 190.2°C) is reached in the mixer’s lower sections in zones 6, 8, 10, 12, 14, and 16. Zones 6, 8, 10, and 12 are in the regio
Data Loading...