Three-Dimensional, Nondestructive Imaging of Low Density Materials
- PDF / 1,750,283 Bytes
- 6 Pages / 417.6 x 639 pts Page_size
- 76 Downloads / 347 Views
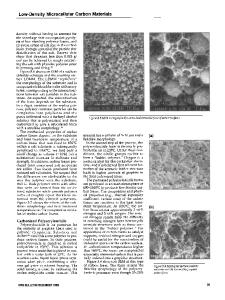
Low-density cellular structures have applications ranging from aerospace to sporting goods. In nature, cellular structures are ubiquitous. Accordingly, their small strain elastic behavior has been extensively studied. For highly idealized foam architectures, the low density limiting behavior of the Young's modulus scales as either p/pm or (p/pr)2 depending on whether the foam has closed- or open-celled porosity, respectively [1,2,3]. The quadratic dependence of the modulus with density in open-celled foams is a result of bending and torsional modes of deformation; whereas, the closed-cell foams resist deformation by direct compression. These pronounced effects of microstructure on scaling behavior potentially provide great flexibility in tailoring foams for optimal strength and stiffness in structural applications. Large deformation behavior is far more complicated than the initial linear elastic response. Typical stress strain behavior of a foam can be highly nonlinear, even when the base material behaves linearly. Stress strain behavior of the 50% dense elastomer foam used in this study is shown in Figure 1. The load displacement curve can be divided into three distinct regions: 1) an initially linear region, 2) a plateau region caused by the buckling of cell walls and the initial collapse of the pore structures, and 3) a region distinguished by a rapid increase in 19 Mat. Res. Soc. Symp. Proc. Vol. 591 02000 Materials Research Society
resistance to continued deformation as the contribution from pore collapse diminishes and the bulk modulus becomes important. This latter region is sometimes referred to as lock-up. We report the results of an imaging study of polysiloxane elastomer foam during quasi-static compressive loading. A complete cycle of loading/unloading was recorded, with particular attention focussed on the pore morphology in the plateau region and the nascent stages of lock-up. The images were meshed for finite-element analysis, and the results were compared with the experimental stress/strain behavior.
0.5
0.4 0.3 unloading
a)
0.2
0.1
0 0.1
0
0.2
0.4
0.3
strain Figure 1: Experimental stress strain behavior for the 50% dense polysiloxane foam pads examined in this study. There were three distinct responses: 1) an initial linear phase to about 0.07 strain, 2) a plateau region that extends to a strain of about 0.3, and 3) a region of rapid rise in resistance to further deformation. Data has been truncated to a maximum stress of 0.5MPa and maximum strain of 0.45. Table 1: Material constants for the two foam materials examined in this study. The apparent density (p.) and cell wall (r) thickness were determined by 3D tomographic imaging. The Young's modulus and Poisson's ratio of the base elastomer were determined from mechanical testing. v Em (MPa) r (Pm) P. (% solid) Specimen .49 106 1.9 49.7 9750
9760
1
40.6
77
20
1
1.9
.49
EXPERIMENTAL METHODS Commercially available elastomer foam was used for this study. The base material was a peroxide cured polysiloxane in which -25 wt. % fume
Data Loading...