Spectroscopic Characterization of Flame-Generated 2-D Carbon Nano-Disks
- PDF / 649,014 Bytes
- 6 Pages / 595.22 x 842 pts (A4) Page_size
- 87 Downloads / 313 Views
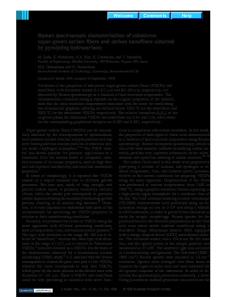
ing an Omicron EA125 analyzer to reveal the photoelectrons excited by the nonmonochromatic radiation of an Al Ka (hν= 1486.7 eV) source. Silver filters were specifically used for the XPS measurements for which an electrical conductive substrate was required. Cyclic-voltammetry (CV) measurements were performed in a previous work [1] to evaluate the energy position of the highest occupied molecular orbital (HOMO) and the lowest unoccupied molecular orbital (LUMO) levels.. To this aim, the carbon compounds were collected on a Teflon filter and suspended in dichloromethane (DCM) following a sonicationassisted solvent extraction, deposited on the platinum electrode and coated with a protective film of nafion. UV–vis absorption and fluorescence spectroscopy was performed on the same materials in the DCM suspensions used for CV analysis.The optical band gap was determined from the absorption spectra using the well know Tauc relation [3]. DISCUSSION The size distribution of the carbon compounds in the gaseous stream, shown in Fig. 1a, is characterized by a monomodal distribution centered at about 2.5 nm (mobility diameter). However, they spread on a mica disk as a consequence of the thermophoretic sampling so that their shapes, measured by AFM, become that of an atomically thin disk, as reported in Fig. 1b. The height profile is reported in Fig. 1c.
(a)
(b)
(c)
Figure 1. Size distribution of the flame-formed compounds in the aerosol phase (a); AFM image of carbon nano-disks on mica surface (b); height profile along the green line (c).
The in-plane shape is spherical, with a diameter of few tens of nanometer whereas the height is just few Ångström. The small diameter measured when the structures are suspended in nitrogen is consistent a crumpled shape taken by the carbon compounds in flame before spreading on the substrate. The Raman spectrum of the sample is reported in Fig. 2a. The most prominent features centered at 1330 and 1612 cm-1 are the two typical bands of a disordered carbon, respectively the D and G lines. The most intense one is positioned at higher wavenumbers respect to the G peak of HOPG and graphene and is also sensibly broader. The shift and broadening are in part due to the presence of the D’ line at about 1620 cm-1 due to disorder, but are primarily indicative of a small size of the graphite islands within the nano-disks similarly to what happens in nanocrystalline-graphite [4, 5].
(a)
(b)
Figure 2. Raman spectra of HOPG, Graphene and flame nano-disk (a); XPS spectra of carbon nano-disk (b). The intensity ratio of the D and G peak has been widely used to estimate the in-plane correlation length of the aromatic islands, La. In amorphous carbon the ratio of I(D)/I(G) follows a non-monotonic trend following an amorphization trajectory from a perfect graphite to a strongly amorphous carbon [30]. In the case of the nano-disks, because of the very large band linewidths and the G band position a quadratic dependency between I(D)/I(G) and La is the most appropriate. Using the equation reported by Ferrari
Data Loading...