Structural Evolution of Rapid Thermal Carbonized Si Surfaces
- PDF / 3,534,228 Bytes
- 6 Pages / 414.72 x 648 pts Page_size
- 55 Downloads / 352 Views
and AFM. A particularly attention was paid to the nucleation behaviour during the heating-up, which is critical for the film structure. EXPERIMENTAL The RTP reactor used in this study was described in detail in [6]. The carbonization of the silicon surfaces was carried out by using (100) and (111) oriented n- and p-type silicon substrates with 5... 10 Q cm resistivity. Prior to carbonization they were cleaned by a RCA process with an additional dip in diluted HF. The carbonization procedure consists of two steps. After loading and pumping down to base pressure (10. Torr) with a following 5 min H2 flush the samples were cleaned in situ in an H2 atmosphere at a flowing rate of 1000 sccm at 10000 C for 60 s. The carbonization was carried out using C3A4 diluted to 5% in H2 at atmospheric pressure. The concentration of C3HAwas adjusted in the range between 0.015% and 1.0% in 1000 sccm H2, the substrate temperature between 1 100°C and 1330°C, heating ramps between 30 and 150 K/s and the holding time in the range from 0 to 120 s. To obtain information about the early stages of the film growth the heating ramp was interrupted after reaching a desired temperature during the ramp-up. A holding time of 0 s was reached but a 1...3 s effective processing time was evident depending on the ramp velocity. The grown films were investigated by ellipsometry, RHEED, optical microscopy and AFM (Rasterscope 3000). 33 Mat. Res. Soc. Symp. Proc. Vol. 355 01995 Materials Research Society
RESULTS AND DISCUSSION The kinetics of the film growth was studied in detail in [4,7,8] and show a saturation thickness strongly affected by the process parameters. Regarding to the growth rate especially for the lowest propane concentration three growth periods were observed: (i) a nearly constant, (ii) a decreasing and (iii) a zero growth rate, respectively. Because of similarities between the growth on (100) and (111) silicon surfaces we confine to the structural evolution of SiC on (111) Si.
Roughness
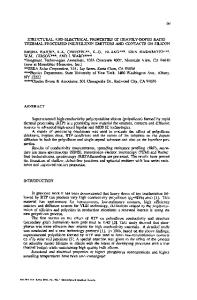
PropaneConcenltallon[%]
Fig.l SiC saturation thickness versus propane concentration at 1250°C on (111) Si 1300 c 1250 1200 b
d
a2o
ii5 so
F
•1100o 1050
°izoo...
2'5 ... a0.. 5.. Processilme (s) Fig.3 Process interruption points
Fig.2b RHEED pattern 0.025% C3H3 . Azimuth
The saturation thickness
Fig.Zb RHEED pattern 0.15% C3H8. Azimuth
shows a strong nonlinear
behaviour and decreases with increasing propane concentration (fig. 1) similar to the observation in [7]. This behawas observed to be independent on the growth tern1perature. The corresponding surface roughness examined by AFM show a decrease with increasing propane concentration (fig.l). Above 0.1...0.15% propane the surface roughness and film thickness are nearly constant. RHEED
]viour
pattern taken from films with higher roughness and film
ithickness were spotty and contained twin SiC (for concen-
trations below 0.05%) and additional Si reflections (fig.2a), whereas in the case of low saturation thickness and roughness large diffuse spots were obtained (fig.2b) indicating a sm
Data Loading...