Temperature Dependent Intermixing at the V/Ge(111) Interface
- PDF / 314,743 Bytes
- 6 Pages / 420.48 x 639 pts Page_size
- 8 Downloads / 273 Views
Mat. Res. Soc. Syrup. Proc. Vol. 54.
1986 Materials Research Society
92
emission. Isothermal measurements were obtained by stabilizing the sample temperature before the beginning of the deposition cycles and holding it fixed throughout (stability of ±5K over a 12 hour period). Each isothermal measurement started from the clean surface, and the results were independent of time. Vanadium was evaporated from a resistively-heated boat after extensive outgassing (pressure during evaporation below 3x 10- 10 Torr, operating pres11 sure better than 5x10- Torr, sample to source distance 30 cm, number of atoms deposited determined with a crystal oscillator).
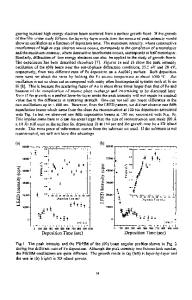
In Fig. 1 we show temperature dependent results for the Ge 3d cores studied at hv = 40 eV for an amount of metal equal to 15 A. Since the energy scale is referred to the substrate emission, band bending effects are not shown. The interface evolves slowly with temperature from an overlayer exhibiting two reacted species to one where a single reacted species is observed. Indeed, at room temperature we can recognize the substrate emission, placed at 0 eV in the relative binding energy scale, the first reacted species shifted -0.5 eV and the second reacted species -0.95 eV. These two reacted species were identified in previous work[6] as having the empirical formulae V2 Ge 3 and V9 Ge, respectively. By increasing the temperature from 300 to 325K, we now see that the relative amounts of the two reacted species change significantly. Indeed, by 380K the second reacted species is below the level of detectability (-e- 3 ) for the coverage reported in Fig. 1. From examination of the complete evolution of these interfaces, we can conclude that the coverage must be increased with increasing temperature in order to produce detectable amounts of this dilute Ge- in-a-V-matrix product. At the same time, the conversion of a very small amount of this dilute product into V2 Ge 3 accounts for significant variations in the Ge signal associated with V2 Ge 3 . The relative growth of the first reacted product (Fig. 1) then suggests that the patches of V-rich V9 Ge in the near surface region are converted to V2 Ge 3 . This conversion proceeds steadily with temperature as more Ge diffuses into the overlayer. For an initial metal coverage equivalent to 15 A, saturation occurs at T = 475K and an almost homogeneous overlayer of V2 Ge3 is formed on Ge(l 11). In Fig. 2 we show isothermal attenuation curves for the Ge 3d signal associated with the substrate (top) and the first reacted component (bottom), In Ii( 0 )/I(0 ). These were obtained by examining the component-specific behavior of the core emission through lineshape decomposition (see Ref. 7 for a discussion of the procedure). There were only slight variations in the attenuation of the substrate component in the range 300 to 475K. Although the slope of these curves should ultimately increase with increasing temperature as more Ge is dissolved in the overlayer to form the first reacted species, we could not follow the attenuation of the sub
Data Loading...