Uterine Infusion With Bone Marrow Mesenchymal Stem Cells Improves Endometrium Thickness in a Rat Model of Thin Endometri
- PDF / 572,872 Bytes
- 2 Pages / 602.986 x 782.986 pts Page_size
- 90 Downloads / 311 Views
Uterine Infusion With Bone Marrow Mesenchymal Stem Cells Improves Endometrium Thickness in a Rat Model of Thin Endometrium
Reproductive Sciences 1-2 ª The Author(s) 2019 Article reuse guidelines: sagepub.com/journals-permissions DOI: 10.1177/1933719119828233 journals.sagepub.com/home/rsx
Original article: Zhao J., Zhang Q., Wang Y., and Li Y. (2015). Uterine Infusion With Bone Marrow Mesenchymal Stem Cells Improves Endometrium Thickness in a Rat Model of Thin Endometrium. Reproductive Sciences, 22, 181–188. doi: 10.1177/1933 719114537715
In the above article, Figures 2, 3 and 4 published on page 185, 186 and 187 are incorrect. The correct figures are published below:
Figure 2. Expression of vimentin, cytokeratin, integrin b3, LIF, and BrdU labeling. A-E, Expression of cytokeratin, vimentin, integrin b3, LIF, and BrdU labeling. A-D, The expression of cytokeratin, vimentin, integrin b3, and LIF was significantly higher in the experimental group than that of the control group (P < .05), and there was no significant difference between the experimental group and the normal group (P > .05). E, BrdUpositive cells only detected in the experimental group, and the number of BrdU-positive cells was significantly different compared with the normal group and the control group (P < .05). BrdU indicates bromodeoxyuridine.
2
Reproductive Sciences XX(X)
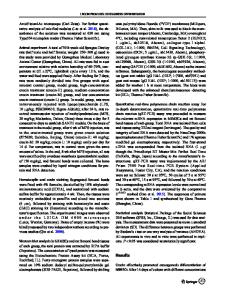
Figure 3. Western blot analysis of the expression of cytokeratin, vimentin, integrin agb3, and LIF. Groups 1-3, normal group, experimental group, and control group, respectively. A and B, The results of Western blot analysis. C, The relative protein levels expressed as the Gray value ratio (% Adj Vol). All the results showed that the expression of cytokeratin, vimentin, integrin agb3, and LIF was significantly stronger in the experimental group than in the control group (P < .05), and there was no significant difference between the experimental group and the normal group (P > .05).
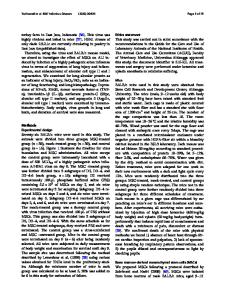
Figure 4. RT-PCR analysis of the expression of bFGFmRNA, IL-6mRNA, IL-1bmRNA, and TNF-a mRNA. A-D, Expression of bFGFmRNA, IL6mRNA, IL-1bmRNA, and TNF-amRNA. E, The relative mRNA content expressed as the Gray value ratio (% Adj Vol). Groups 1-3 (1’-3’), normal group, experimental group, and control group. Groups 1’-3’: Internal reference GAPDH. The results showed that the expression of bFGFmRNA and IL-6mRNA was significantly upregulated in experimental group compared with the control group (P < .05), and the expression of IL-1bmRNA and TNF-amRNA was significantly downregulated in the experimental group compared with the control group (P < .05). RTPCR, reverse transcription polymerase chain reaction; bFGF, basic fibroblast growth factor; mRNA, messenger RNA; IL, interleukin; TNF, tumor necrosis factor a; GAPDH, glyceraldehyde 3-phosphate dehydrogenase.
Data Loading...