Waveform and Spectral Analyses of the 2011 Japan Tsunami Records on Tide Gauge and DART Stations Across the Pacific Ocea
- PDF / 2,103,607 Bytes
- 19 Pages / 547.087 x 737.008 pts Page_size
- 6 Downloads / 333 Views
Pure and Applied Geophysics
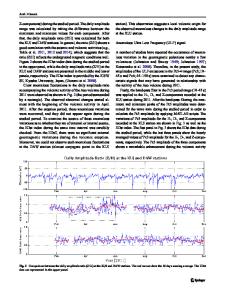
Waveform and Spectral Analyses of the 2011 Japan Tsunami Records on Tide Gauge and DART Stations Across the Pacific Ocean MOHAMMAD HEIDARZADEH1,2 and KENJI SATAKE2 Abstract—We studied the 11 March 2011 Tohoku tsunami through analysis of the sea level records from 21 tide gauge and 16 DART (Deep-ocean Assessment and Reporting of Tsunamis) stations from across the Pacific Ocean. The extreme power of this trans-oceanic tsunami was indicated by the trough-to-crest heights of 3.03 m at Arena Cove on the western coast of the USA and 3.94 m at Coquimbo on the southern coast of Chile. The average value of the maximum amplitude was 163.9 cm for the examined tide gauge records. At many coastal tide gauge stations the largest wave arrived several hours after the first arrival of the tsunami wave, and the tsunami lasted for a long time with an average duration of 4 days. On the contrary, at most of the DART stations in the deep ocean, the first wave was the largest, the tsunami amplitudes were smaller with an average maximum of 51.2 cm, and the durations were shorter with an average of 2 days. The two dominant tsunami periods on the DART records were 37 and 67.4 min, which are possibly attributed to the width and length of the tsunami source fault, respectively. The dimensions of the tsunami source was estimated as 233 km 9 424 km. Wavelet analyses of tide gauge and DART records showed that most of the tsunami energy was distributed at the wide period band of around 10–80 min during the first hour after the tsunami arrival, then it was concentrated in a relatively narrower band. The frequency-time plots showed the switches and lapses of tsunami energy at the 35and 65-min period bands. Key words: 2011 Tohoku tsunami, tide gauge data, DART stations, wavelet analysis, spectral analysis, numerical modeling, tsunami energy.
1. Introduction On 11 March 2011 at 5:46:24 GMT (14:46:24 Japan local time) (USGS 2011) a giant earthquake occurred offshore of northeastern Japan rupturing
1 Faculty of Civil and Environmental Engineering, Tarbiat Modares University, Chamran Highway, Pol-e-Gisha, P.O.Box: 14115-397, Tehran, Iran. E-mail: [email protected] 2 Earthquake Research Institute (ERI), University of Tokyo, Tokyo, Japan.
around 450 km of the Japan Trench (FUJII et al. 2011). The earthquake was followed by a mega-tsunami causing massive destruction and deaths along the Pacific coast of northern Japan. Post-tsunami field surveys showed that the Tohoku mega-tsunami severely damaged three prefectures of Miyagi, Fukushima, and Iwate and caused damage in other regions like Hokkaido, Aomori, Ibaraki and Chiba prefectures (TAKAHASHI et al. 2011). The parent earthquake of the tsunami was one of the largest ever-recorded in history ranking fourth after the Chilean earthquake of 1960 (Mw 9.5), the Alaskan earthquake of 1964 (Mw 9.2), and the recent Sumatra–Andaman earthquake of 2004 (Mw 9.1). The earthquake epicenter was at 38.297oN and 142.372oE (USGS 2011) (Fig. 1) having a depth of around 10 km. This mega
Data Loading...