Winners or Losers? NGOs in the Current Aid Paradigm
- PDF / 131,173 Bytes
- 7 Pages / 539 x 703 pts Page_size
- 57 Downloads / 282 Views
Thematic Section
Winners or Losers? NGOs in the Current Aid Paradigm
CATHERINE AGG
ABSTRACT Catherine Agg examines the trends in non-governmental organizations (NGOs) and asks if the ‘golden age’ of NGOs is behind us? Although NGOs have become increasingly important actors in development policies in the last two decades, current donor rhetoric stresses the need to work with recipient governments to reduce poverty. She examines the extent to which recent policy developments have affected the standing of NGOs, looking at (i) the proportion of ODA channelled to the NGO sector by the main bilateral donors; (ii) funding trends for individual NGOs. She presents a mixed picture in terms of funding trends, pointing to a change for INGOs in the current development paradigm rather than their demise. KEYWORDS aid instruments; funding trends; donors; development cooperation; civil society; capacity building
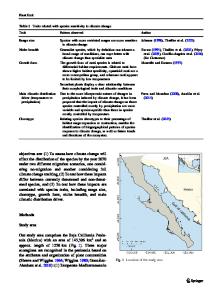
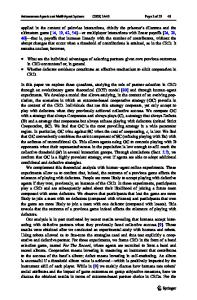
Analysis of ODA disbursements to NGOs While the debate surrounding the position of non-governmental organizations (NGOs) in the current development environment is producing a growing body of literature,1 little concrete research has been done on how this is affecting the funding of the sector as a whole. This section looks at recent trends in Overseas Development Assistance (ODA) going to NGOs from DAC member countries using OECD data, which allows comparison of trends by country as well as worldwide. The tables in this section are all based on DAC statistics available online (http://www.oecd.org/dataoecd/50/17/5037721.htm, accessed10 June 2005). They are presented with the major caveat that any data illustrating NGO activity is notoriously unreliable. Figure 2 shows the percentage of ODA going to NGOs increased during this period from 0.18 per cent of total ODA in1980 to 6.0 per cent in 2002. In monetary terms, NGOs worldwide received US$ 4054.83 million in official aid from DAC member countries in 2003, in comparison with US$ 47.64 million in 1980 (Figure 1). In light of this dramatic rise, and in the absence of any steep decline subsequently, the concerns of the NGO sector about their funding base might seem unfounded. However, the overall trend masks variations between DAC member states ^ funding trends are not quite so comfortable for NGOs in all countries. Development (2006) 49(2), 15–21. doi:10.1057/palgrave.development.1100252
Development 49(2): Thematic Section ODA to NGOs (US millions)
35
4500 4000
30
3500 3000
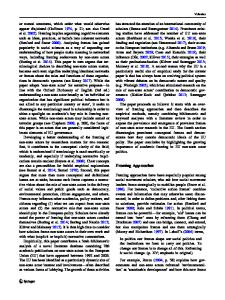
Proportion of ODA channelled through NGOs (%) Canada Sweden Switzerland
25
2500 20
2000 1500
15
1000 10
500 2004
2002
2000
1998
1996
1994
1992
1990
1988
1986
1984
1982
1980
0
5
1980 1981 1982 1983 1984 1985 1986 1987 1988 1989 1990 1991 1992 1993 1994 1995 1996 1997 1998 1999 2000 2001 2002 2003
0
Figure 1: ODA to NGOs (US millions).
Figure 4: Proportion of ODA channelled through NGOs (%). Proportion of ODA to NGOs (%) 7 6 5 4 3 2 1 2002
2004 (preliminary)
2000
1998
1996
1994
1992
1990
1988
1986
1984
1982
1980
0
Figure 2: Proportion of ODA to NGOs (%). Net disb
Data Loading...