Correction to: Short-term progression of cardiometabolic risk factors in relation to age at type 2 diabetes diagnosis: a
- PDF / 166,422 Bytes
- 2 Pages / 595.276 x 790.866 pts Page_size
- 56 Downloads / 280 Views
CORRECTION
Correction to: Short-term progression of cardiometabolic risk factors in relation to age at type 2 diabetes diagnosis: a longitudinal observational study of 100,606 individuals from the Swedish National Diabetes Register Andri O. Steinarsson 1 & Araz Rawshani 2 & Soffia Gudbjörnsdottir 2,3 & Stefan Franzén 3 & Ann-Marie Svensson 3 & Naveed Sattar 4
# Springer-Verlag GmbH Germany, part of Springer Nature 2019
Correction to: Diabetologia https://doi.org/10.1007/s00125-017-4532-8 Unfortunately, the symbols in Fig. 1 were incorrectly described in the legend. The corrected figure is given here.
The online version of the original article can be found at https://doi.org/ 10.1007/s00125-017-4532-8 * Soffia Gudbjörnsdottir [email protected] * Naveed Sattar [email protected] 1
School of Health Science, Faculty of Medicine, University of Iceland, Reykjavík, Iceland
2
Department of Molecular and Clinical Medicine, Institute of Medicine, University of Gothenburg, Gothenburg, Sweden
3
The Swedish National Diabetes Register, Västra Götalandsregionen, Gothenburg, Sweden
4
BHF Glasgow Cardiovascular Research Centre, Institute of Cardiovascular and Medical Sciences, University of Glasgow, 126 University Place, Glasgow G12 8TA, UK
Diabetologia
b
34
HbA1c (mmol/mol)
BMI (kg/m2)
a
32 30 28 0
2
4
6
60.0 57.5 55.0 52.5 50.0 0
8
2
Time from diagnosis (years)
4
6
8
Time from diagnosis (years)
d HDL-cholesterol (mmol/l)
c 2.4 2.2 2.0 1.8 1.6 0
2
4
6
8
1.4 1.3 1.2 1.1 0
2
Time from diagnosis (years)
4
3.2 3.0 2.8 2.6 0
6
Time from diagnosis (years)
e LDL-cholesterol (mmol/l)
Triacylglycerol (mmol/l)
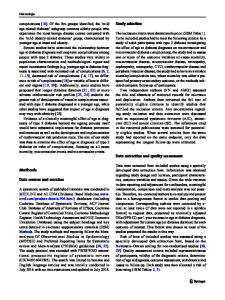
Fig. 1 Yearly averages (95% CI) stratified by age group for (a) BMI, (b) HbA1c, (c) triacylglycerol, (d) HDLcholesterol and (e) LDLcholesterol. Circles, 18–44 years old; squares, 45–59 years old; diamonds, 60–74 years old; triangles, ≥75 years old. All analyses, p < 0.05 where 95% CI do not overlap
2
4
6
Time from diagnosis (years)
8
8
Data Loading...