Fine Structure and Magnetooptics of Excitonic Levels in Wurtzite GaN
- PDF / 420,248 Bytes
- 6 Pages / 414.72 x 648 pts Page_size
- 4 Downloads / 394 Views
interaction or a strain field [1]. With the advances in the growth technology of the group-Ini nitrides GaN, InN and AIN, as well as their ternary alloys this group of wide-gap semiconductors with wurtzite crystal structure has become technologically quite important. Their optical properties and electronic structure, however, are only poorly understood. Data in the literature on excitonic fine structure splittings [2,3,4] and effective masses of charge carriers [5-11] of GaN exhibit some scatter or are still incomplete. Thus, closing the gap in the knowledge of these materials has become an urgent matter. EXPERIMENTAL The experimental approach taken in this work is the careful analysis of the direct, i.e., zero-phonon exciton emission in low-temperature photoluminescence spectra from highquality samples. To be able to distinguish between luminescence polarized parallel and perpendicular to the c-axis we detected only light from a side face of the epilayers which were 300 and 400 prm thick. The samples used for this study are high-quality GaN epilayers grown on (0001) sapphire by hydride vapor phase epitaxy (HVPE). Photoluminescence was performed under continuous-wave (cw) excitation at 325 rum using a HeCd laser. The sample was mounted in an immersion cryostat for zero-field experiments at 2 K. For magnetoluminescence experiments in Faraday configuration a 15 T split-coil magnet was employed. To obtain spectral positions with as high an accuracy as 555 Mat. Res. Soc. Symp. Proc. Vol. 482 0 1998 Materials Research Society
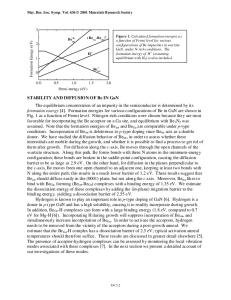
possible from the PL measurements we performed lineshape fits to the measured spectra using only symmetric Gaussian and Voigt line shapes for the individual peaks. For each spectrum the complete range of free-exciton luminescences was fitted in order to obtain the highest possible accuracy in energy positions. RESULTS The State n=l of the A-Exciton Figure 1 displays the polarized low-temperature emission in the range of the n=l state of the A-exciton observed from a side face of a free-standing 300 pm thick sample. In Figure 1 (a) the detected light is polarized perpendicular to the c-axis, in Figure 1 (b) parallel. Both
spectra are well fitted by a sum of two peaks and the underground from the neighboring weak 800B-exciton emission on the lowenergy side and the stronger donor(a) Elc kic . GaN 600- T=1.8K k bound B-exciton (D°,XB) on the FL low-energy side. While the high40o. E energy peak is seen at the same " 200. rST " energy of 3.48000 eV in both polarizations within our o.
..... . (b) E l c
250-
r
200
kic
E-c
experimental accuracy a difference in the low-energy peak positions is observed between the
perpendicular and parallel polariof Figures 1 (a) and (b), respectively. In perpendicular polarization 3.47904 eV is the
kO 100-.zations 50o
Energy (eV) Figure 1: Polarized low-temperature photolumi-
measured peak position while in parallel polarization we find 3.47892 eV. We identify the latter
nescence spectra taken from a side face of a 300 pm
value with that of the spin triplet
t
Data Loading...