Formation of Subthreshold Defects in Erbium Implanted Silicon
- PDF / 1,145,989 Bytes
- 8 Pages / 417.6 x 639 pts Page_size
- 101 Downloads / 327 Views
Mat. Res. Soc. Symp. Proc. Vol. 532 0 1998 Materials Research Society
vacancies and self-interstitials. Sashan and Washburn [2] suggested that the incorporation of implanted doping atoms on substitutional lattice sites leads to one excess interstitial silicon per implanted atom. The "kick out" mechanism, also referred to as the "+1 model", later has been confirmed by Giles [3]. However, this mechanism cannot explain an excess of silicon interstitials in the case of implanted atoms that stay on interstitial sites like erbium [4] and oxygen [5]. The aim of this paper is to enhance the understanding of the formation mechanism of subthreshold defects. EXPERIMENTAL Erbium with has been implanted an energy of 4.5 MeV into p-type (100) Cz-silicon. This
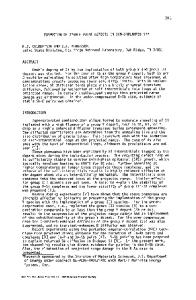
resulted into a projected range of 1350 nm in depth, as has been measured with Secondary Ion Mass Spectrometry (SIMS). Some samples have been co-implanted with oxygen with an energy of 1.4 MeV, resulting in a projected range of 1600 nm. The damage due to these deep implantations has been kept below the amorphization threshold of the silicon host material. One sample has been additionally implanted with a high dose of 80 keV phosphorus that resulted in a shallow amorphous layer below the wafer surface. After implantation, the samples were annealed at 900TC for 30 min. In order to study the interaction of the coimplantations during annealing the samples with co-implantations have not been annealed between implantations. Table I summarizes the samples discussed in this work. The secondary defects have been studied in cross-section using a Philips EM 400 T electron microscope with an acceleration voltage of 120 keV. RESULTS
Do
DEr
sample
(1:0)
(0:6)
3
13
x 2.5. 10 cm2
1
Dp
x 1.35. 10 cm-2
x 7.-10cm-2
-
-
(1:6) (2:2)
1
6 6
2
2
-
(P:2:2)
2
2
1
-
-
Table 1: Description of the samples investigated in this work. The first digit within bracketsrepresentsthe erbium implantationdose in units of 2.5. 10"cm-2. This correspondsto an erbium peak-concentration of 5.1017 cm-3. The second digit stands for the oxygen implantation dose in units of 1.35. 10' 3 cm-2, which equals an oxygen peak-concentration of 5.101' cm-'. The name of the sample that has been additionally implanted with a phosphorus implantationdose of 7- 10`cm- isprovided with a P within the brackets.
178
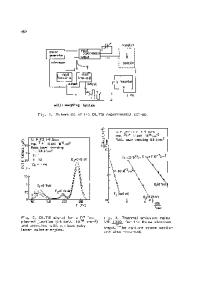
RESULTS Fig. I shows a XTEM dark field-photograph of the (1:6) specimen. The subthreshold defect band seen here is typical for the subthreshold defects observed for all erbium implanted samples, i.e. (1:0), (1:6), (2:2) and (P:2:2). The (0:6) sample, that has been implanted with oxygen only, did not show any post annealing defects with TEM. While the (1:0), (1:6) and (2:2) samples show one defect band in the proximity of the erbium implant, the (P:2:2) sample shows an additional shallow defect band of end-of-range defects close to the heavy phosphorus implantation. End-of-range defects occur as secondary defects after high dose implantations in which the primary defect concentration exceeds the
Data Loading...