On Kinetically vs. Energetically Driven Growth Instabilities in Solid and Vapor Phase Epitaxy
- PDF / 493,104 Bytes
- 9 Pages / 420.48 x 639 pts Page_size
- 65 Downloads / 308 Views
233 Mat. Res. Soc. Symp. Proc. Vol. 618 ©2000 Materials Research Society
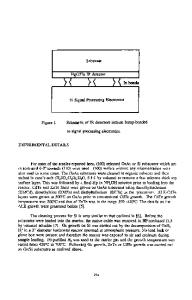
All of this work assumes that the relevant transport coefficient (the surface diffusion coefficient for surface diffusion limited growth, or the reaction mobility or step-edge attachment rate constant for interface reaction limited growth) is independent of stress. We have previously called attention to the mobilities of the interfaces or atoms involved in growth [13, 14] and characterized the stress-dependence of mobilities [14-18], and we and others have predicted how the changes in mobility due to stress also help determine the growth morphology [5-7, 10-12, 16, 19, 20]. Within transition state theory, the dependence upon stress oof an atomic or interfacial mobility M is characterized by the activation straintensor [ 14] OlnM -*=kT JIV A positive (negative) V,, for example, implies that M is reduced (enhanced) upon the application of a compressive oall. Just such a dependence of the interfacial mobility on stress has been observed [14, 16] in SPEG of Si(001), characterized by Vj- = +0.14 times the atomic volume Q of crystalline Si. A positive V,,gives rise to a kinetically driven morphological instability during growth under compressive (i.e., negative) all. For a sinusoidally perturbed interface between a growing crystalline phase and a fluid or amorphous parent phase in which stress is at least partially relaxed, or between two elastic phases in which the growing phase has higher moduli, there is a stress concentration in the trough and a stress relaxation at the peak of the perturbation, as shown in Fig. 1. The stress concentration in the trough results in a local interfacial mobility that is smaller than that at the peak; hence the peak grows faster and the perturbation tends to amplify. I call this the Barvosa-Carter ("BC") instability [10, 16].
•
0, from Eq. (2). t =0.0041. Below each line the AT instabilitydominates; above each line the BC effect causes absolute stability.Lines are parameterizedby IPI = 0.01, 0.03, 0.05, 0.10, 0.15, 0.30, and 1.00 from top to bottom; on the right-handside P > 0 and on the left-hand side 1V< 0. Cross indicates SPEG experimentalconditions. "x" indicates upper limiting value for Si8 oGe2o MBE experiments discussedin text.
237
The BC term is a destabilizing influence when VE < 0, e.g. a positive V,, (as in SPEG) and compressive stress. The BC effect dominates the instability when
G
I -- E--
V
(3)
T
From Eq. (3), a map of the regions of (E,G )-space dominated by the AT-driven instability and the BC-driven instability effects is presented in Fig. 4. The boundary curve identified with V7=+0. 15 is the relevant one for SPEG; one sees that the actual driving free energy for SPEG places the process well into the BC-dominated regime. Note that if the actual value of V for Si 80 Ge 20 MBE were even as low as +0.05, the transition from AT-dominated to BC-dominated instability occurs at G • 0.1, which is less than 1/4 of the bulk (3D vapor -- 3D solid) driving force. From this model it seems that unl
Data Loading...