Hydrogen Bond Configuration Changes in PECVD Silicon Nitride Films During RTA
- PDF / 313,679 Bytes
- 6 Pages / 414.72 x 648 pts Page_size
- 105 Downloads / 404 Views
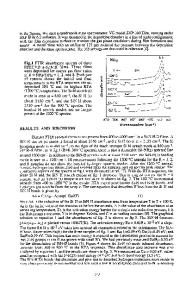
Experimental PECVD silicon rich (x4/3) silicon nitride films were deposited using a silane, ammonia, and nitrogen mixture at 400'C in a dual frequency parallel plate reactor (Novellus Concept One-200). The NH 3 and N 2 flows for the process were fixed at 4slm and 1.6slm, respectively, while the SiH 4 flow was varied, from 0.3 to 0.6slm. Under these conditions, the index of refraction for the deposited films ranged from 1.938 to 2.117. Growth rate of the nitride increased with increasing silane flow. Chamber pressure was maintained at 2.6 Torr and deposition power was 0.45kW at 13.6MHz and 0.55kW at 29kHz. The nitrides were annealed by Rapid Thermal Annealing (RTA) for 30 seconds at different temperatures. Nitrogen was employed during the anneal process to minimize oxidation of the sample surfaces. FTIR spectra were measured before and after the RTA process. The major peaks found in the infrared spectrum of silicon nitride are [5]: (a) an N-H stretching vibration centered at about 3335cm-1, (b) an Si-N stretching vibration centered at about 860cm-I, (c) an Si-H stretching vibration centered at about 2200cm-1, and (d) an Si-Si breathing vibration at 450cm- 1. Hydrogen Forward Scattering (HFS) was also measured for some of the nitrides in order to monitor the hydrogen effusion as a result of the anneal process. N-rich Silicon Nitride In the nitrogen-rich silicon nitride films, excess hydrogen is mainly bound to the unsatisfied N atoms. Figure 1 shows the changes in integrated intensities for the N-H and Si-H stretching bands as a function of anneal temperature. As a result of the anneal process, the integrated intensity of N-H stretching band in the FTIR spectrum of the N-rich nitride decreases while the Si-H stretching band increases to a maximum at 650 0 C, then decreases. The integrated intensities of the absorption bands may be directly related to the respective concentrations of bonding sites via the infrared absorption cross section for that particular oscillator. Figure 2 shows that the number of Si-N bonds remains relatively constant for anneals over the same temperature range. Conversely, the quantity of Si-Si bonds decreases as a function of RTA temperature (see Figure 3). Because the substrate absorbance was not subtracted from the spectrum, the Si-Si region contains contributions from the Si substrate as well. To calculate the activation energy for hydrogen release from the N-rich nitride we assume that (1) there is no free hydrogen in the nitride, and (2) the hydrogen release is a thermally activated process which follows the Arrhenius equation: (No-N)/No = exp (-Ea/kT)
(1)
where No is initial N-H concentration of the N-rich nitride. Plotting ln[(No-N)/No] vs. 1/kT (Figure 4) yields a straight line with a slope corresponding to an activation energy of 0.43 eV for the hydrogen loss in N-rich silicon nitride. We did not calculate the activation energy for hydrogen loss from the Si-H bonding site in the N-rich nitride because of its small integrated intensity in the infrared spectrum and the uncertainty inv
Data Loading...