Modification of Magnetron Sputtered A-Si 1 - X c x :H Films by Implantation of sn +
- PDF / 486,775 Bytes
- 6 Pages / 414.72 x 648 pts Page_size
- 106 Downloads / 389 Views
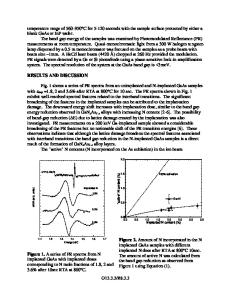
ESULTS AND DISCUSSION Optical Properties A considerable modification of the optical properties has been achieved by ion implantation of Sn' in a-SiO. 82C0. 18:H films as demonstrated in fig. la. This effect is more markedly pronounced with the increase of the ion dose D. As is evident in the figure the transmission edge moves to the lower photon energies accompanied by a decrease in the transmission coefficient, as a result of the ion implantation. i
1
I
t0 .8 B
.2 .6
10
"•.4 .2 o
10
0 500
1000
1500
2000
4
2500
Wavelength [nm]
1.5
1.9
2.3 2.7 Energy (eV)
3.1
3.5
Fig. 1. Transmission (a) and absorption coefficient spectra (b) of the as deposited (A) and implanted with Sn÷ 2 2 2 a-Sio 0 82C0 I8:H films at doses: D, = 10'1cmM (B), D2 =1016 cm (C) and D3 = 101i cmn (D). The spectrum D is featureless due to increased reflection from the metallized film surface. Figure Ib demonstrates the changes of absorption coefficient spectra with the dose. It is evident that ion implantation considerably increases a in a narrow region around 2.2 eV (1.8-2.4 eV) and shifts the absorption edge to the lower photon energies even for the lowest dose (D1) which signifies a change in the energy spectrum of the electronic states. A saturation is reached when increasing the dose. In this case an increase in a of more than one order of magnitude is achieved, which is comparable with the effect obtained by Ar' bombardment induced amorphization of crystallized a-SiC films [1]. The observed change may be related to the breaking of bonds due to ion bombardment and the possible introduction of additional bonds between implanted ions and the atoms of the alloy. X-Ray Photoelectron Spectra of As Deposited a-Sii.xCC:H Films Figure 2 shows the Cls (a) and Si2p (b) spectra of as deposited a-Si 0.82C 0 ,8:H films. Curve A of fig. 2a represents the C ls spectrum on the surface of the film and curve B - the same spectrum after 30 minute al
C1as dep.
13
4
A~A 2io
21iB
290
Binding energy (eV) Fig. 2. XPS spectra of Cls (a) and Si2p (b) electrons on the surface (curve A) and after 30 min. Art sputter etching (B) of an as deposited a-Sio 82CO I 8:H film. The spectra are offset for clarity.
244
sputtering with Are. Figure 2b shows Si2p spectra of the as deposited a-Si0 .82C0 18:H films on their surface (curve A) and after 30 minute sputtering (curve B). After an analysis of the spectra shown in fig. 1 which have been made in details previously [4] one can conclude that the chemical bonds in the as deposited aSi0.s2C0 .1:H films are the expected ones - Si-Si, Si-H, C-C, C-H and Si-C. Carbon in the films is mainly in the form of hydrogen-rich C clusters. In addition, 0 bounded to Si as well as to C is present in the films. X-Ray Photoelectron Spectra of a-Si.xC :H Films Implanted with Sn÷ 1 2 2 Two samples implanted with different doses of tin - l X 10' cm- and l X 10 6 cm- - were studied. The C Is spectra of the surface (curve A) and at different sputtering times (curves B - E) of the sample implanted with the higher dose are present
Data Loading...