The effect of processing conditions on the structure of buried interfaces between silicon and silicon dioxide
- PDF / 1,813,268 Bytes
- 6 Pages / 414.72 x 648 pts Page_size
- 85 Downloads / 328 Views
303 Mat. Res. Soc. Symp. Proc. Vol. 448 © 1997 Materials Research Society
I=
21ý
Seff Here se
2
sin 2OtXYSf)(1) (Irt(x, Y)Sey
ag
2S2+ s is the deviation parameter that measures
the distance between the
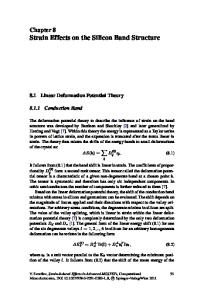
Ewald sphere and the Bragg condition in reciprocal space when the image is taken, and g is the extinction distance. It can be proved that even for a large deviation parameter (s > 0. 1nm 1) and thickness variations at a scale smaller than a unit cell, equation (1) still holds with a little modification 2. From equation (1), we can see that the same thickness change will introduce a larger relative intensity change with a larger deviation parameter. The intensity is therefore more sensitive to interface or surface configurations with increased deviation parameter. The penalty paid here is a decrease in the intensity as shown in figure
1. Practically, it is possible to image atomic steps if an appropriate deviation parameter is chosen and the background noise is reduced by controlling the size of the objective aperture 2,3
T1hickness (nm)
Figure 1. A theoretical calculation of intensity as a function of the local specimen thickness with different deviation parameter s is shown here. The dashed line has a deviation parameter of O.2nm-'. The solid line has a deviation parameter of 0.6 nm-1 The graph shows that although the intensity is decreased with the increase of the deviation parameter s, the sensitivity to thickness changes is increased as shown in the solid line. More thickness fringes show up for a larger deviation parameter. Equation (1) shows that although the intensity is sensitive to step positions, it is not directly related to the step distribution on the interfaces. -Step distributions have to be retrieved from the original transmission electron mficroscope images. First we filter the images in Fourier space to remove the noise. We combine high-frequency filtering and amplitude filtering4 . Values with a frequency higher that a certain value and an amplitude smaller than a certain threshold are removed in the Fourier transformed image in reciprocal space. Then the image is transformed back to real space to obtain the new filtered image.
From this filtered image, we trace each fringe manually with NIH Image Tm. The maximum
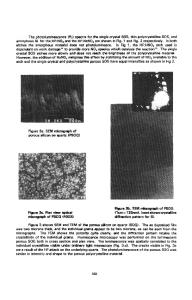
number of steps that each fringe corresponds to and the step height can be found from the deviation parameter. Images with different deviation parameters are compared to determine if the steps are up-going or down-going. With all this information available, a step distribution and a height map of the interfaces can be retrieved. Figure 2 gives an example of a step profile obtained from an original TEM image. From the step distribution, the roughness frequency spectrum can be found and detailed analysis, such as calculating the auto-correlation function of step positions can be performed. From equation (1), the root-
304
mean-square roughness can also be estimated from the deviation parameter of a dark-field image in which thickness fringes start to disappear due to roughnes
Data Loading...