Reduction of Environmental Impacts in Crystalline Silicon Photovoltaic Technology: An Analysis of Driving Forces and Opp
- PDF / 227,608 Bytes
- 10 Pages / 612 x 792 pts (letter) Page_size
- 99 Downloads / 329 Views
1041-R01-01
Reduction of Environmental Impacts in Crystalline Silicon Photovoltaic Technology: An Analysis of Driving Forces and Opportunities Erik Alsema1, and Mariska de Wild-Scholten2 1 Copernicus Institute, Utrecht University, Heidelberglaan 2, Utrecht, Netherlands 2 Unit Solar Energy, Energy research Centre of the Netherlands (ECN), Westerduinweg 3, Petten, Netherlands ABSTRACT We give an overview of historical developments with respect to the price and the Energy Pay-Back Time of crystalline silicon photovoltaic modules. We investigate the drivers behind both developments and observe that there is a large overlap between them. Reduction of silicon consumption, improved cell efficiency and the production technology for solar grade silicon have been identified as major drivers for both cost and impact reductions in the past. Also we look into future prospects for reduction of environmental impacts. It is estimated that developments underway to reduce costs will also result in a reduction of the Energy Pay-Back Time of a PV installation (in SouthEurope) from 1.5-2.0 year presently to well below 1 year.
INTRODUCTION In this paper we will look at historical trends in the prices and in Energy Pay Back Time (EPBT) of crystalline silicon PV modules since 1975. The prices are regarded as a proxy for production costs while the EPBT can be considered as good indicator for the environmental imapcts of PV technology. We will identify the drivers that have contributed to the decrease of prices on the one hand and EPBT on the other hand, and investigate the overlap between these drivers. After this historical perspective we will look into future prospects with respect to new c-Si cell concepts and future module production technology and estimate possible reductions in the medium term.
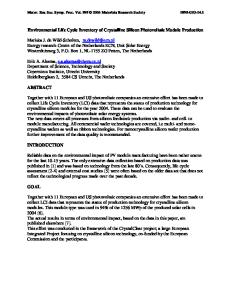
ANALYSIS OF HISTORICAL TRENDS Figure 1 shows the development of module prices and module production volumes since 1975 [1-3]. We have added to this graph the Energy Pay-Back Time that can be determined from a number energy analysis or Life Cycle Assessment studies that have been published over the same period [4-8]. The Energy Pay-Back Times have all been calculated for a hypothetical roof-top system in South-Europe with an array-plane irradiation of 1700 kWh/m2 /yr and a Performance Ratio of 0.75. Energy requirements for Balance-of-System (BOS) components have been assumed the same for all historical data sets, namely 70 MJ (primary energy) per m2 module area for supports and cables and 1300 MJ/kWp for the inverter. In this way the EPBT values will reflect the developments
in energy requirements for the modules only1. For the data set from Hunt (1976) which did not include energy inputs for the process steps of module assembly and framing we assumed for these steps the same values as given by Hagedorn (1992). Except for the data by Hunt all values are valid for modules based on multicrystalline silicon. 9000 8000
50
7000 6000
40
5000
30
4000 3000
20
2000
10 0 1975 1980
Module production (MWp/yr)
Module Price (€-2006/Wp) Energy
Data Loading...