Electrical Resistance Anomalies During Electromigration Testing of Cu Conductor Lines: Examples of Local Melting?
- PDF / 1,450,086 Bytes
- 5 Pages / 612 x 792 pts (letter) Page_size
- 37 Downloads / 414 Views
0914-F06-08
Electrical Resistance Anomalies During Electromigration Testing of Cu Conductor Lines: Examples of Local Melting? Hongqing Zhang, Gan Wang, and G. S. Cargill III Materials Science & Engineering, Lehigh University, 5 E. Packer Ave., Bethlehem, PA, 18015
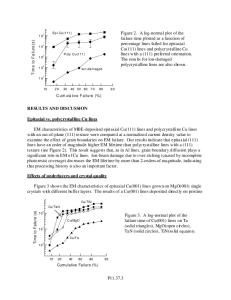
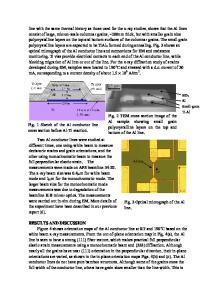
ABSTRACT We have measured the resistance changes during electromigration (EM) testing of damascene Cu conductor lines with TaN liners and W vias. During EM, we observed an abrupt resistance increase, followed by a sudden resistance decrease, to values close to before the start of EM. Microstructural observations and thermal calculations suggest that the resistance decrease results from sudden, local Joule heating and melting of conductor line segments, and voids being partially filled by the back-flowing liquid Cu, which then solidifies. SAMPLES AND EXPERIMENTAL CONDITIONS Cu conductor lines were 0.16µm thick and 100µm long, deposited on SiO2 with TaN liners and W vias. Three different line widths, 0.2µm, 0.8µm, and 2µm, were studied. Results for the 2µm wide sample are described in this paper. A more complete report will be published elsewhere. The plan view optical image of the 2µm line is shown in Fig. 1(a), and its cross section is sketched in Fig. 1(b). The sample consists of three 100µm long conductor lines connected in series, but separated by W vias. Current is injected through wires bonded to two pads, which are connected to the ends of the Cu line through W vias. The voltage is measured using wires bonded to the other two pads, and it includes voltage drops in vias, CoSi, and poly-Si segments as well as the conductor lines, as shown in Fig. 1(b). The resistance changes were monitored during EM at 300C and with 1.6MA/cm2 current density. The results are shown in Figs. 2. Anode
Cathode e
Figure 1(a) Optical image of plan view of the 2µm wide sample
Figure 1(b) Cross section view of samples
RESULTS AND DISCUSSION The resistance of the Cu lines is just a small part of total resistance, and most of the resistance is from the W vias, the CoSi and poly-Si sections. The estimated resistance for the 2µm wide Cu lines is 36 ohms. From Fig. 2(a), before EM the resistance of the sample was about 975 ohms and decreased to about 900 ohms during the first 63 hours. As shown in Fig. 2(b), after 63.6 hours, the resistance increased to 920 ohms. After 65.1 hours, the resistance increased suddenly to about 1,000 ohms, and continued to increase more gradually until 68.2 hours, when the resistance reached 1,100 ohms, about 100 ohms higher than the resistance before EM. The resistance then decreased abruptly to about 925 ohms and continued at this value until the line failed at 69 hours. Similar behaviors were also observed for 0.8µm and 0.2µm wide lines. Since the increase of resistance is due to the formation of voids, the sudden drop in the resistance must be associated with the healing of voids. This could happen when the local heating around the voids causes the Cu to melt, and the liquid Cu flows back into the voids. This would require the local temperatu
Data Loading...