A Study on the Strain and Microstructure in SiGe Film Grown on Si(001) Substrate by MBE
- PDF / 2,727,248 Bytes
- 6 Pages / 414.72 x 648 pts Page_size
- 61 Downloads / 240 Views
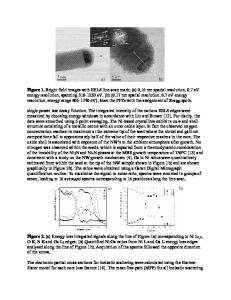
liquid nitrogen temperature. During the first stage of ion milling, the energy of the ions was 4 keV with glancing angle of 150, and during the later stage of the ion milling, even lower energy 3 keV with 12' of glancing angle was used to minimize the damage induced by ion milling. The samples were observed using Philips CM20 T/STEM transmission electron microscope. Rutherford backscattering spectrometry (RBS) was also used to study the crystalline quality and the composition of the SiGe films. RESULTS AND DISCUSSION Figure 1 shows (004) reflection rocking curves of the Si/SiGe/Si samples grown at various growth temperatures. As shown in Fig. 1, for the sample grown at 250 °C, peak from the SiGe film is detected but is very broad. As the temperature increases, the SiGe peak becomes sharp indicating good crystalline quality. However, at the growth temperature above 520 'C, the SiGe peak again becomes broad implying the degradation of film quality. Values of the full width at half maximum (FWHM) of the SiGe peak are shown in table II and Fig. 2. From the Fig. 2, it is apparent that Si 0.Ge 02 films with good crystalline quality are obtained at the temperature range of 440 - 600 'C. According to RBS analysis, channeling yield of Ge peak is minimum at the same temperature range consistent with the above DCXRD result.
Si-sub.
W
SiGe 760
0
Figure 1. (004) reflection rocking curves of Si/SiGe/Si "samplesgrown at various growth temperatures.
68 680 °C o•
520 C
2350
-2000
-1000
.C
0
Rocking Angle (arcsec) Quantification of strain at various growth temperature was also accomplished using doublecrystal X-ray diffractometry. Surface-symmetric (004) reflections were used to obtain the epilayer lattice parameter normal to the interface. In-plane lattice parameters were measured using the two [ 115) reflections in both the glancing-incidence and glancing-exit configurations. All
320
10
2000
10
2000
perpendicular strain Li-. 5
Is
Is
•
0
4)
[
1000 C
IJ,
LA.
FWHM
/
cJ[].... 0.
.5 """f-5
u.
500
--
0 WJ
In-plane strain -10 200
, 300
•
, > 0.--"•
,
,
40U
500
•
, 600
.
, 700
. 800
Temperature (°C) Figure 2. Elastic strains (perpendicular and in-plane) and FWHM vs growth temperatures. the measurements were carried out two times (00 and 1800 rotation with respect to the surface normal) along the [110] direction of sample. Peak splitting values (AO) were averaged over the two experimental values. The strain measurement technique has been described elsewhere [4]. The perpendicular (plane-normal) and in-plane lattice mismatches (i.e., X-ray strains: ef, e,"), elastic strains (el, efl), misfit (e,) , and strain relaxation (R) are calculated using equations in table I, and the results are summarized in table II. The composition (x) of SilxGex layer was calculated using Vegard's law. Note a slight variation in the layer compositions (a nominal value x=0.20) of the samples grown at 250 'C and 680 'C in table 11. The elastic strains (perpendicular and in-plane) are also plotted in Fig. 2 as a func
Data Loading...