Surface Induced Calcium Phosphate Nucleation and Growth
- PDF / 359,368 Bytes
- 7 Pages / 414.72 x 648 pts Page_size
- 53 Downloads / 376 Views
(1)
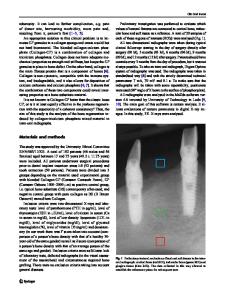
Critical parameters for film formation including the nucleation induction time, nucleation density, and particle growth rate are also controlled by S, a, and T[2]. The key to successful thin film deposition is to increase the solution supersaturation level S and reduce the net interfacial energy ;. The latter can be achieved if only the role of surface chemistry is understood. Another challenge to us is the number of calcium phosphate phases involved in the crystallization process. These phases include dicalcium phosphate dihydrate (DCPD, CaHPO 4 .2H 2 0), octacalcium phosphate (OCP, Ca 8 H 2(PO 4) 6.5H2 0), tricalcium phosphates (a and BTCP, Ca 3 (PO4 )2), and hydroxyapatite (HAP, Calo(OH) 2 (PO 4 )6). The actual phase deposited on implants depends on both solution and substrate conditions and must be controlled to produce optimal implant coatings. As shown in Figure 1, for pH > 4, the solubility of the calcium phosphate phases decreases in the order DCPD > OCP > TCP > HAP. Since calcium phosphate solutions are always more supersaturated with respect to HAP than the other phases, one might expect that HAP would always be the easiest phase to nucleate based on Equation 1. However, for homogeneous nucleation, ease of nucleation actually follows the trend DCPD > OCP > TCP > HAP. The observed trend is in agreement with
35
Mat. Res. Soc. Symp. Proc. Vol. 414 01996 Materials Research Society
Ostwald's rule [31 which states that the least stable phase having the highest solubility forms first. Ostwald'rule works because the least soluble phases usually have the highest interfacial energy barrier to nucleation. However, for heterogeneous nucleation, interactions involving the substrate can substantially lower the nucleation barrier. The purpose of this investigation is to determine if interfacial energies can be lowered sufficiently to nucleate preferentially desired calcium phosphate phases.
2. 3. 4. 5. .4o 0
6. 7. 8. 9. 10. 2
3
4
5
6
7
8
9
10
pH
Figure 1. Solubility isotherms of various calcium phosphate phases as a function of pH at 25oC. (A): CC experiment conditions listed in Table II. Tca: total concentration of Ca2+ (mol/L). Tp: total concentration of phosphate (mol/L). 60 A1203
40TiO 2
20 0U
SiO 2
0
-20-40-
0
2
4
6
8
10
12
pH
Figure 2. Zeta potentials of A12 0 3, TiO 2 and Si0 2 as a function of pH. Solids loading = 0.5 vol %, ionic strength = 0.01 M NaCl, temperature = 23oC This work is aimed at understanding the effect of surface chemistry on the calcium phosphate nucleation kinetics and phase formation, using native oxide surfaces as a model system. The selected colloidal surfaces of Si0 2, TiO 2 and A120 3 have very different surface charge properties, as reported previously (Figure 2)[4]. For example, at pH 6.5, Si0 2 surface
36
is negative, TiO 2 is near neutral, and A12 0 3 is positive. In addition, as charges of these surfaces strongly depend on solution pH, one can vary the surface charge by simply changing the pH. EXPERIMENT The commercial products, (X-A12 0 3 (AKP-3
Data Loading...