Phase Transition of LiMn 2 O 4 Spinel and its Application for Lithium Ion Secondary Battery
- PDF / 257,688 Bytes
- 6 Pages / 414.72 x 648 pts Page_size
- 75 Downloads / 363 Views
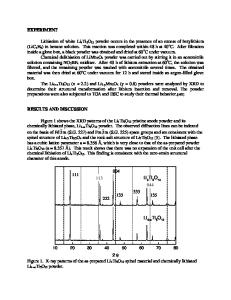
an EC(Ethylene Carbonate)/DEC(Diethyl Carbonate)=30/70 mixed solvent. The electrochemical tests were performed at a constant current, 40 hour rate, with a voltage range from 3.0 to 4.3 V. Details of the cell assembly method were reported elsewhere. [4] RESULTS AND DISCUSSION Jahn-TellerDistortion The X-ray diffraction patterns of the (xi=l.00 and 1.10 samples at 300K and 250K are shown in figure 1, respectively. Both of the cz=l .00 and 1.10 samples at 300K can be indexed with cubic symmetry. The X-ray diffraction peaks of the at=1.00 sample at 250K were obviously split. Yamada reported that the phase transition of LiMn 2O4 was from cubic, Fd3m, at higher temperature to mixed phase of cubic and tetragonal, 14M/amd at lower temperature. [6] In order to confirm the phase transition, Rietveld refinement for the 250K phase was carried out. The best fit for the 250K phase is obtained assuming orthorombic symmetry, Fddd, as a fist step. The calculated lattice constants from 310K to 20K for (x.=l.00 and 1.10 are shown in figure2 (a) and (b), respectively. The calculated lattice parameters of the (x=1.00 sample at lower
4000,
'
I
'
I
'
Lil.iMn204
(400 Cubic Fd13m
2000
a a
I
)K 300K
_Lii.oMn2O4
3000
'
300K (4 00) Cubic Fd3m
I 000
I1
m
V •
4000
m
.......
I
I
I
Lil.0M n204
I
I 2I
250K
3000 a,1 2000 .,.
1000
42
43 44 45 20 (deg./Cu K a )
46 42
45 44 43 2 0 (deg./Cu K a )
FIG. 1. X-ray diffraction patterns of Li 1 oMn,0 4 (left) and Lil.,Mn 2O4 (right) at 300K (top) and 250K (bottom)
288
46
temperatures were based on the orthorombic symmetry model. In figure 2(a), we see that the lattice parameter, b, increases with decreasing temperature, in contrast a and c decrease with decreasing temperature. This result also suggests that the 250K phase is not a mixed phase, but a single phase with the orthorombic symmetry. Strictly speaking, the 250K phase may have lower symmetry than orthorombic symmetry because the fitting is not enough. 8.3 (b)
8.25 -
...........
K 8.2 U
Cubic (Fd3m)
8.15
0
200 100 Temperature (K)
300
0
100
200
300
Temperature (K)
FIG. 2. Temperature dependence of lattice parameters of (a) Li,.,Mn 20 4 and (b) Li1 ,Mn 2O4. 107
106
E C:
105
VJ
10o3 200
250 300 Temperature (K)
350
FIG. 3. Temperature dependence of the resistivity for Li,.oMn 2O4 and Lil. MnO 289
4
Figure 3 shows temperature dependence of the resistivity for the (X.1.00 and 1.10 samples. The temperature dependence of the resistivity for the (x=l.10 and cx=l.00 sample show semiconductor-like behavior. With decreasing temperature, the resistivity for the (-=1.00 sample increases by nearly an order magnitude at 290K. In contrast, for the ct=-1.10 sample, no such anomaly is observed. In order to clarify the effects of the phase transition on the electrochemical property of the manganese spinel, discharge curves from coin cells were taken at 0, 20, 45'C. These temperature are below, intermediate and above the phase transition temperature, respectively. The obtained curves for cx=1.00 and 1.10 sa
Data Loading...